





1
FormatOur AI agent asks: qualitative or quantitative?
Because they sit in no panel and don't answer for points. We ask them where they already are: on social media. One-off surveys, trackers, your own questionnaires in the field. Plus simulations for indicative pre-studies and more.
Illustrative photos, not our respondents. Photos (Unsplash): Tatiana Zanon, Matteo Vistocco, Good Faces, Centre for Ageing Better, Ghen Mar Cuaño, Desola Lanre-Ologun.
 uses Boomerang in the SRF Trend Surveys sample
Weighted by region, age, gender.
Validated with the University of Zurich: pre-study 2021 · study II 2023/24
Your tool, our field. Not from a panel.
We recruit, you interview.
10–30 minutes, plausibility 0–10. A language model fine-tuned on our own survey data.
Twelve brand metrics, Brand Equity Score.





“We use Boomerang Ideas to gather fast market & consumer insights for our clients and ourselves. It helps us make informed decisions and suggest concepts based on consumer insights.”
 Patrick Glauser · Managing Partner, TMI AG
“The insights we gained from Boomerang Metrics were invaluable in refining and improving our marketing strategy.”
 Carsten Richter · Digital Manager, Lindt & Sprüngli
“Running six targeted Boomerang surveys across multiple markets proved to be fast, intuitive, and engaging. The Boomerang platform delivered professional insights that enabled us to validate our personas and refine our targeting strategy with confidence.”
 Philipp Köstner · Lead Online Marketing, BERNINA International
“When you're not sure a new product adds real value, Boomerang Ideas gets you solid, real-market feedback for very little money or effort.” Ivan Mele · Founder, HEYNEW product testing Translated from German
36 % → 6 %
Phone response rate, 1997 → 2018.
Pew Research Center (US)
<1 % → 34 %
Panel members → questionnaires, top 10 US panels.
comScore, 2006
1
FormatOur AI agent asks: qualitative or quantitative?
2
QuestionnaireThe agent's draft, a template, a blank start or your own.
3
Simulation optionalSimulated answers for an indicative result.
4
FieldworkNothing to do. Fresh social media recruitment for every study.
5
Weighting and resultsWeighted in the dashboard, live during fieldwork.
So you hear from people classical fieldwork no longer reaches.
Boomerang vs. established online panel.
81 % vs. 37 %
Passed attention checks.
42 % vs. 20 %
Stay until the end.
UZH study II (USA): n = 1,000 Boomerang, n = 1,000 Qualtrics
2.91 vs. 3.04
Trust in science (1–4): lower, less desirability bias.
p = .001
3.76 vs. 3.96
Survey experience (lower, less practised).
p < .001
2 of 3
Closer to the result than institutes.
UZH pre-study: 13 surveys, n = 416–976
0.25 vs. 3.6
Points off, Nevada 2024. Internal, single case.
100 % human sampling, US 2024
An independent judge model, Confidence Guard™, scores every simulation from 0 to 10.
The simulation holds.
The ranking holds, the percentages not yet.
This question needs people to answer it.
Our own recruitment, new for every study: on average 7 to 10 days to the result.
The only platform that runs both engines itself and measures them against each other continuously.
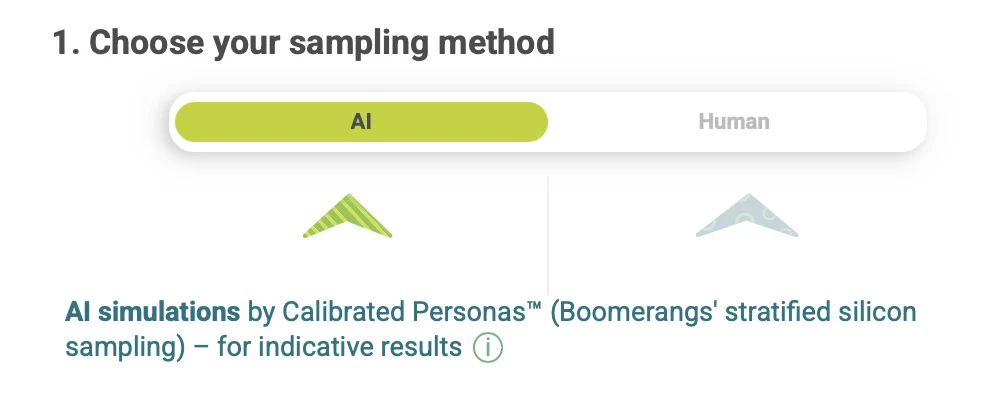
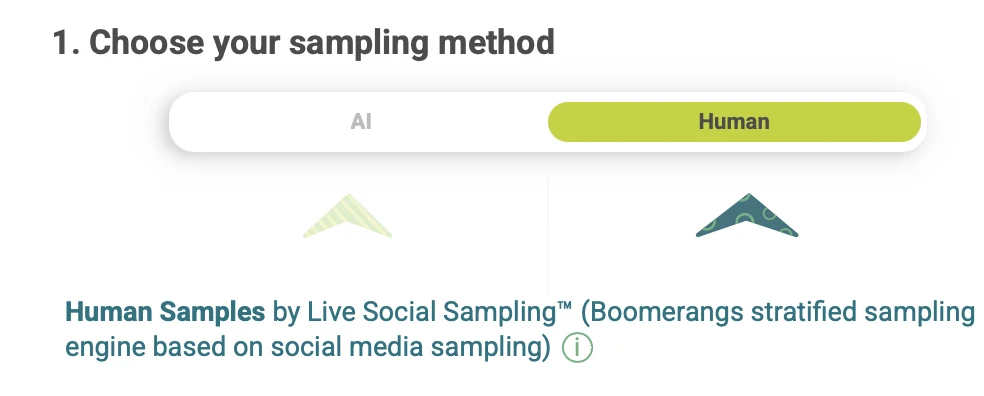
Plausibility measures consistency and fit, never accuracy against a known result.
Funded several times by Innosuisse since 2020. The current project, «Confidence-Driven Augmentation of Synthetic Survey Data», runs with the University of Basel and Johns Hopkins University.
Germany from CHF 4 per completed response, Switzerland and Austria from 5.
Binding after the free pre-test. Target group not found: money back.
only the credits used
CHF 1,950 · 4,950 · 11,950
same price, more credits
CHF 0
1 preview study a month
CHF 200 / month
or CHF 2,000 a year
6 full studies a month
Pays off at 1 report a month
Start with ProPrice on request
3 seats
10 full studies a month
Simulated respondents included each month: 200 · 3,000 · 10,000. Extra seats (Pro, Team): CHF 150 a month.
Breakdowns by age, gender or region: reliable for human samples; for simulations, read subgroup results as indicative.
Add-ons: 200 credits per study. 1 credit = CHF 1, valid for every social sampling product.
Reply within 1–3 working days.
24: Argentina, Australia, Austria, Brazil, Canada, Czech Republic, France, Germany, India, Italy, Kenya, Mexico, Nigeria, Poland, Portugal, Saudi Arabia, South Africa, South Korea, Spain, Sweden, Switzerland, Thailand, the UK and the USA.
7–10 days on average, first answers after 24 hours.
You do. GDPR and Swiss FADP compliant.



⠿ verschieben
Als anonym